

Not just “is it up?”.
But “how is it doing?”
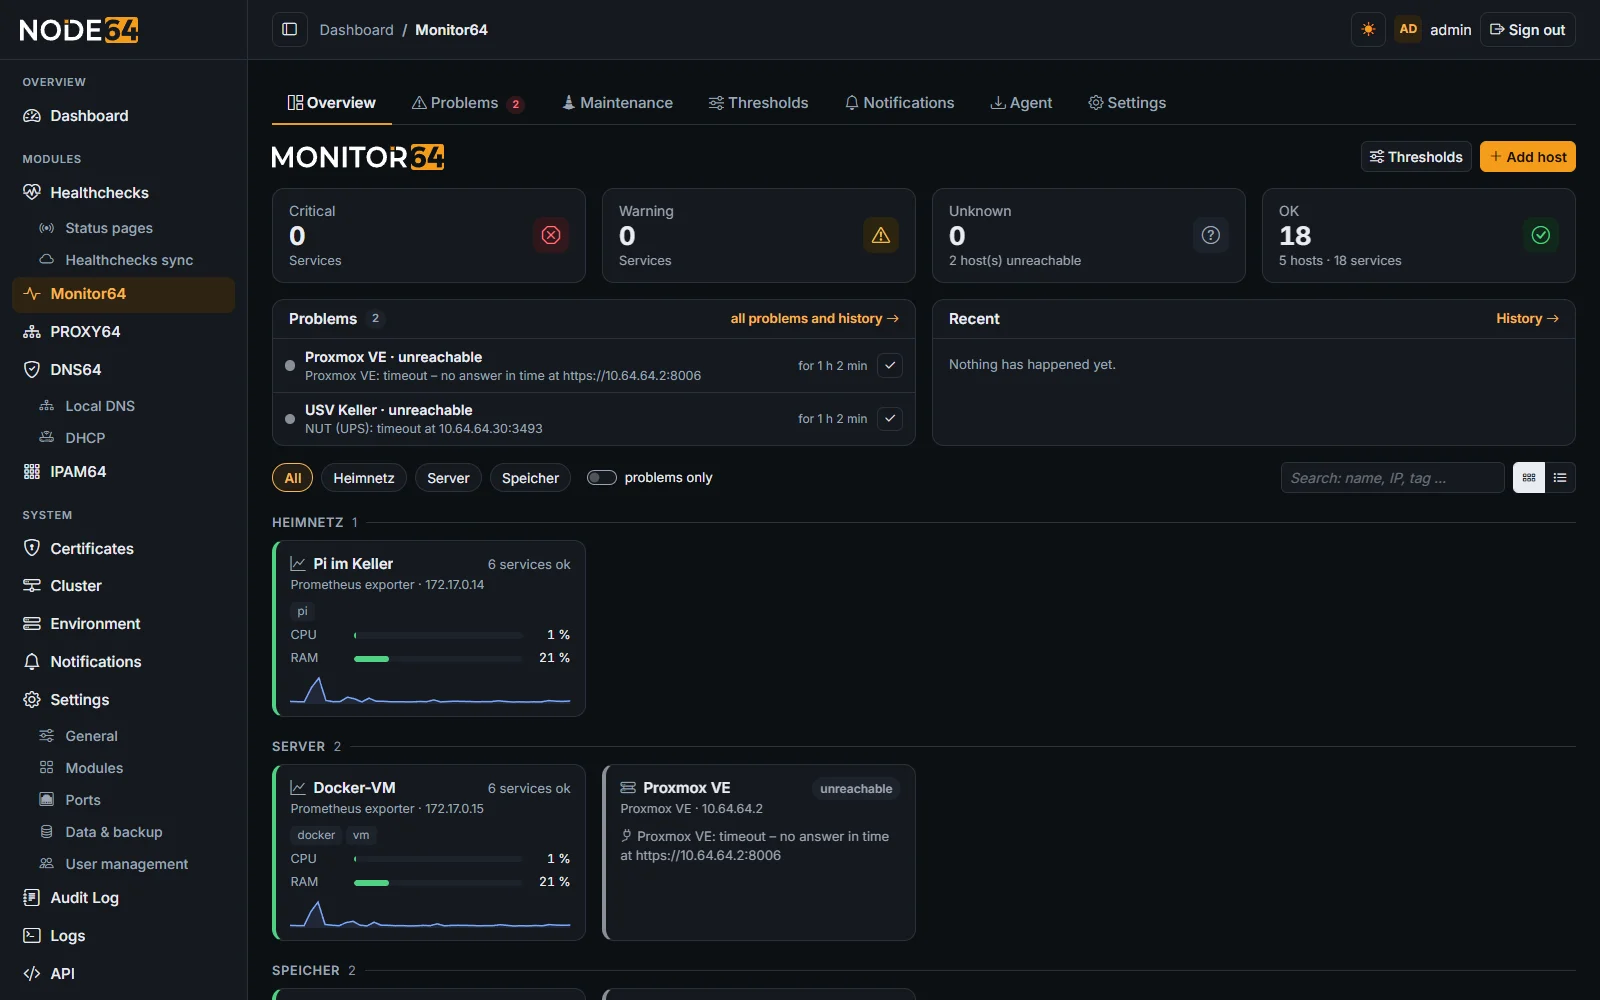
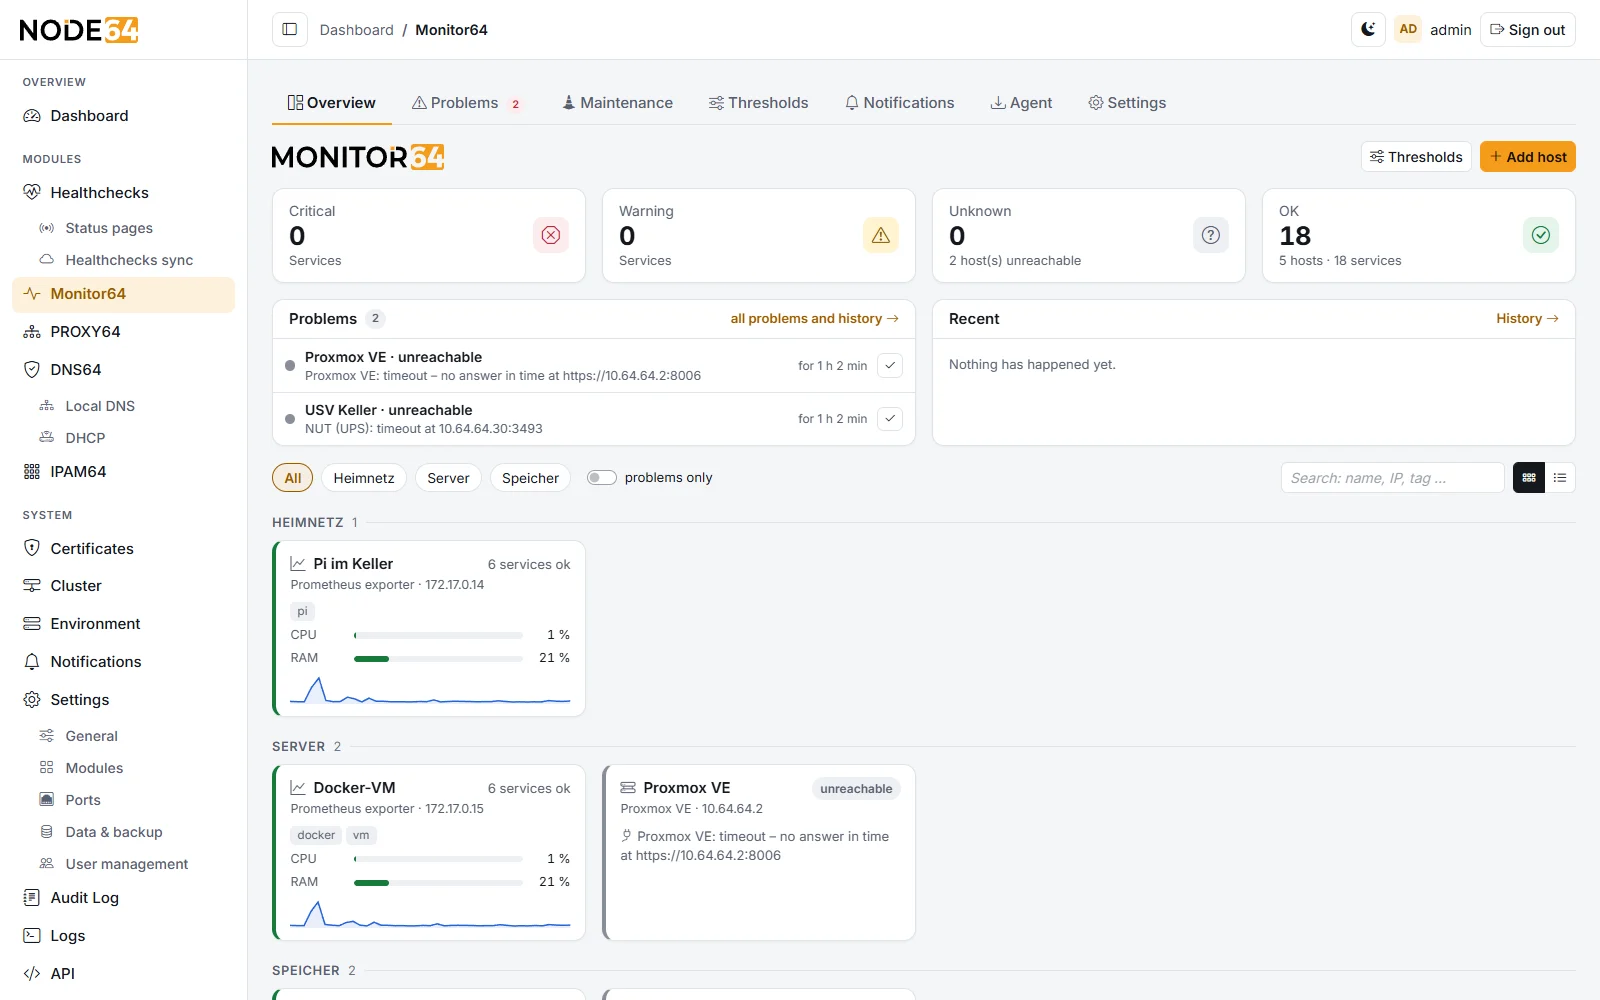
Monitor64 watches your servers, NAS, hypervisors, containers, mail servers, switches, UPS and printers with metrics, thresholds and history: CPU, RAM, file systems, disks including SMART, network ports, temperatures, updates and services. When things get tight, you get an alert – before something fails. Made for homelabs up to small businesses, deliberately lighter than CheckMK or Zabbix.
 ┌─────────────────────────────────────────┐
 │ Node64 · Monitor64                      │
 │ thresholds · problems · history · maint.│
 └──┬──────────┬───────────┬───────────┬───┘
    │ agent    │ SSH       │ API       │ SNMP
    ▼          ▼           ▼           ▼
 ┌───────┐ ┌────────┐ ┌──────────┐ ┌─────────┐
 │Linux  │ │Synology│ │Proxmox VE│ │switch   │
 │Windows│ │Unraid  │ │PBS·Docker│ │router   │
 │FreeBSD│ │applian.│ │TrueNAS   │ │UPS·NAS  │
 └───────┘ └────────┘ │iDRAC·iLO │ │printer  │
                      └──────────┘ └─────────┘
Two questions, two modules
Health checks answer “is it up?” – reachable or not, locally and from outside via ipv64.net. Monitor64 answers “how is the system doing?” – with metrics, thresholds and history. Both work independently and complement each other: the health check watches the website, Monitor64 the disk underneath.
- Warn before, not after: “file system full in 2 days”, “SSD 90 % worn”, “UPS only 10 minutes left”.
- One alert, not a hundred: if a host stops answering, you get exactly one “unreachable” alert – not one per service.
- Together on the status page: checks under “Services”, systems from Monitor64 under “Systems”.
What Monitor64 monitors
A host is a monitored system, an access is the way to its values. Several accesses per host are possible – for example the Proxmox API plus the agent for bonding and temperatures.
Monitor64 agent
A single program without dependencies for Linux, Windows and FreeBSD/OPNsense – down to the Raspberry Pi Zero, with power supply and under-voltage: CPU, load, RAM, file systems, disk I/O, SMART, network per port, bonding/LACP, temperatures, ZFS/RAID/Btrfs, inodes, services, updates, “reboot required” and your own scripts. Behind NAT it connects to the node itself; updates arrive signed and automatically.
Linux without an agent
Where nothing should be installed – Synology, Unraid, appliances – the node logs in via SSH with its own key and reads the same values as the agent.
Proxmox VE & Backup Server
Node, VMs and containers, storage, ZFS, disks including SMART, cluster, HA, Ceph and updates. For PBS: datastores, age of backups per group, verify, GC, prune and sync jobs. One click turns a guest into a host of its own.
Docker & Podman
Containers with state, health check, CPU, RAM and restarts – via the local socket, TCP or SSH. Podman via its Docker-compatible API.
NAS & server BMC
TrueNAS and Unraid via their API: pools, disks, temperatures, tasks, apps and VMs. iDRAC, iLO and others via Redfish: power supplies, fans, temperatures, drives. UPS via NUT: battery, load, runtime.
Network: SNMP, MikroTik, UniFi & FRITZ!Box
Switches, routers, NAS, UPS and printers with v1, v2c and v3. Device profiles for Synology, QNAP, TrueNAS, MikroTik, UniFi, APC and more; ports with utilisation, errors, link down and half duplex. Known traps trigger an immediate poll. MikroTik from RouterOS 7 via the REST API, UniFi via the Network Application with ports and PoE, the FRITZ!Box via TR-064 with DSL values.
Proxmox Mail Gateway & mailcow
Mail queue with a threshold and the largest target domains, quarantine, services or containers – for the Mail Gateway also throughput, ClamAV signatures, cluster and updates.
Prometheus exporters
If you already run node_exporter or windows_exporter, use them directly – mapped to the same services as the agent, plus your own metrics with thresholds.
Detect, don't impose
The wizard shows what to do on the host, tests the connection and lists the services found. Only what you select is adopted – new services come as a hint, never automatically.
Sensible defaults, finely adjustable
Usually the defaults are enough. You set exceptions per group, tag or directly on the host – the most specific level wins, every field inherits on its own.
- Duration and hysteresis: a threshold only counts when all measurements in the period are above it; values at the edge don't flip back and forth.
- Trend: alert when a file system will be full in 7 or 2 days.
- Fixed rules: SMART FAILED, RAID/ZFS degraded, bond member gone, security updates, guest not running, backup too old and more.
| Metric | Warning | Critical |
|---|---|---|
| CPU usage (15 min) | 90 % | 95 % |
| RAM used (5 min) | 80 % | 90 % |
| File system, pool, datastore | 80 % | 90 % |
| Disk temperature HDD/SSD · NVMe | 50 °C · 70 °C | 60 °C · 80 °C |
| SSD wear | 80 % | 90 % |
| Port utilisation (5 min) | 80 % | 90 % |
| Toner/ink below | 15 % | 5 % |
| UPS runtime on battery below | – | 10 min |
More than graphs
Monitor64 brings what turns metrics into operations – using what Node64 can do anyway.
Problems with a timeline
When opened, where alerted, who acknowledged or resolved – also as CSV. Acknowledging stops reminders until it gets worse.
Maintenance windows
For hosts, groups or tags: now, planned or recurring. Recording continues, alerts only come afterwards – if something is still wrong then.
The node's channels
Telegram, Discord, ntfy, e-mail and all other Node64 channels – selectable per level, with reminders, quiet hours and calm for flapping services.
Status pages
Hosts and single services appear on the health check status pages in the “Systems” section – to the outside only label and state, no values or addresses.
Cluster with standby node
In a Node64 cluster exactly one node monitors each host. If it fails, a standby node takes over after about 2 minutes – without duplicate alerts.
Built to be safe
The agent only knows fixed queries, no shell. Node and host identify each other with keys; credentials only go to confirmed fingerprints and are stored encrypted.
Prometheus & API
States and values as metrics for Grafana, every function via JSON API with an OpenAPI description.
Export & backup
Monitor64 is fully included in the node's config export and backup; the history lives in its own file in the data directory.
Monitor64 and typical alternatives
Big monitoring systems can do a lot, but need their own server and time to learn. Monitor64 covers what homelabs and small businesses really need – inside the container that's running anyway.
| Feature | Monitor64 | Classic monitoring (e.g. CheckMK, Zabbix) | Uptime monitor (e.g. Uptime Kuma) |
|---|---|---|---|
| Metrics with thresholds and history | only up / down | ||
| Agent for Linux, Windows, FreeBSD | signed, auto-update | – | |
| Proxmox VE/PBS, Docker, TrueNAS, Unraid, mailcow out of the box | wizard | partly via plugins or templates | partly (reachability) |
| SNMP with device profiles and traps | – | ||
| Needs its own server and database | no, inside the Node64 container | usually yes | no |
| Learning curve | minutes, defaults out of the box | days | minutes |
| Checks from outside and a public status page | with health checks + ipv64.net | add-on needed | |
| More modules in the same container | health checks, PROXY64, DNS64, DynDNS64, Honeypot64 | – | – |
Information on the alternatives reflects general knowledge for a typical installation; features may change with new versions.
Frequently asked questions
Everything else is explained step by step in the Monitor64 docs. Questions and wishes are welcome in the v64.tech forum.
Know how your systems are doing
Install Node64, switch on Monitor64 under Settings → Modules, add your first host. The first values arrive right away.
Goes well with: health checks watch websites and services locally and from outside, the certificate management supplies Proxmox and NAS with Let's Encrypt.

